

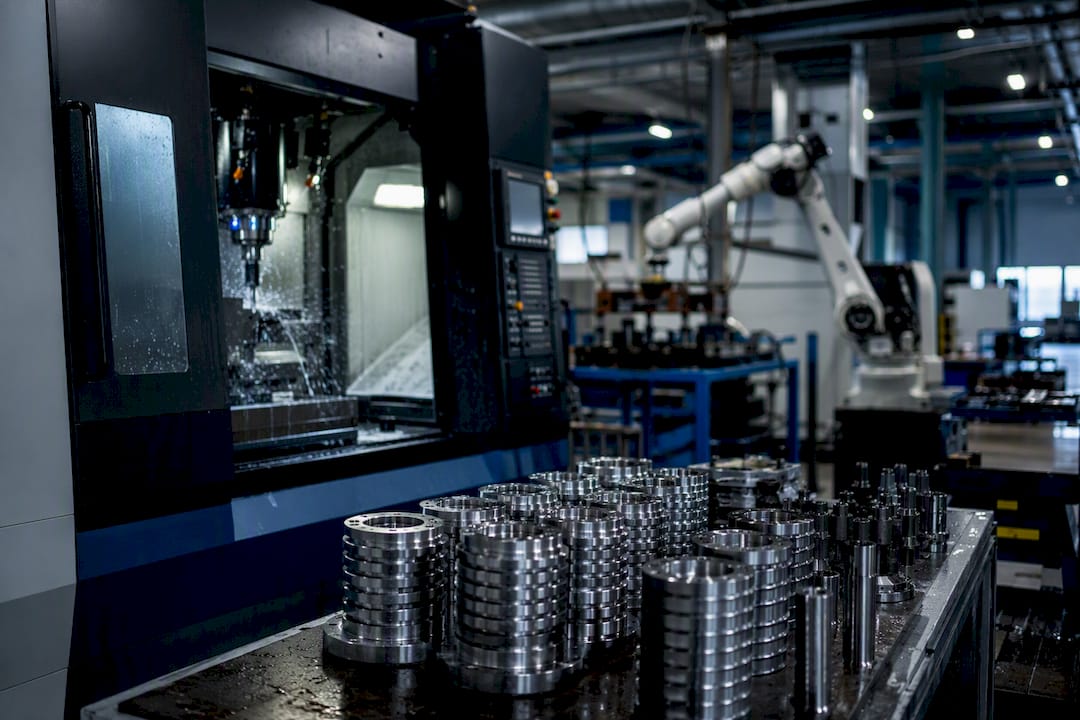
Production throughput is the rate of conforming, deliverable units a process produces per unit of time. The formula in its simplest form: Throughput = Good Units ÷ Net Available Time. If a machine produces 950 quality-released parts in a 7.5 hour shift, throughput is 126.7 units per hour. Scrapped and reworked parts don’t count. Throughput measures what actually ships, not what the spindle theoretically could have made.
Key Takeaways
Throughput equals good units divided by net available time, and improving it requires protecting the bottleneck rather than speeding up every station equally.
| Point | Details |
|---|---|
| Count only good units | Exclude scrap and rework from throughput; only quality-released parts represent real output. |
| Use net available time | Divide by net production time, not full clock time, to avoid overstating throughput. |
| Fix the constraint first | Improving non-bottleneck stations rarely raises system-wide throughput. |
| Apply Little’s Law | Lead Time = WIP ÷ Throughput; cutting WIP shortens lead time when throughput holds steady. |
| Track uptime and yield together | A throughput gap usually traces to changeovers or quality loss, not raw machine speed. |
Table of Contents
- What Throughput Actually Measures on the Shop Floor
- Key Formulas and a Worked Throughput Calculation
- Throughput vs. Cycle Time vs. Lead Time: What’s the Difference?
- Which KPIs Should You Track Alongside Throughput?
- What Factors Reduce or Increase Delivered Throughput?
- How Do You Actually Improve Manufacturing Throughput?
- How Should You Measure Throughput in Your Plant?
- What Most Plants Get Wrong About Throughput
- Sources
What Throughput Actually Measures on the Shop Floor
Throughput is not the same as your machine’s rated cycle speed. A Hydromat rated for 1,200 parts per hour on paper rarely delivers that number once you account for tool changes, adjustments, and rejects. IEEE’s definition of throughput is specific about this: only conforming units count, because a part that fails inspection never reaches the customer and never generates revenue.
Three things determine the gap between rated speed and real throughput:
- Availability — how much of the scheduled time the machine actually ran
- Performance — how close to ideal cycle time it ran while running
- Quality — what percentage of output passed inspection on the first pass
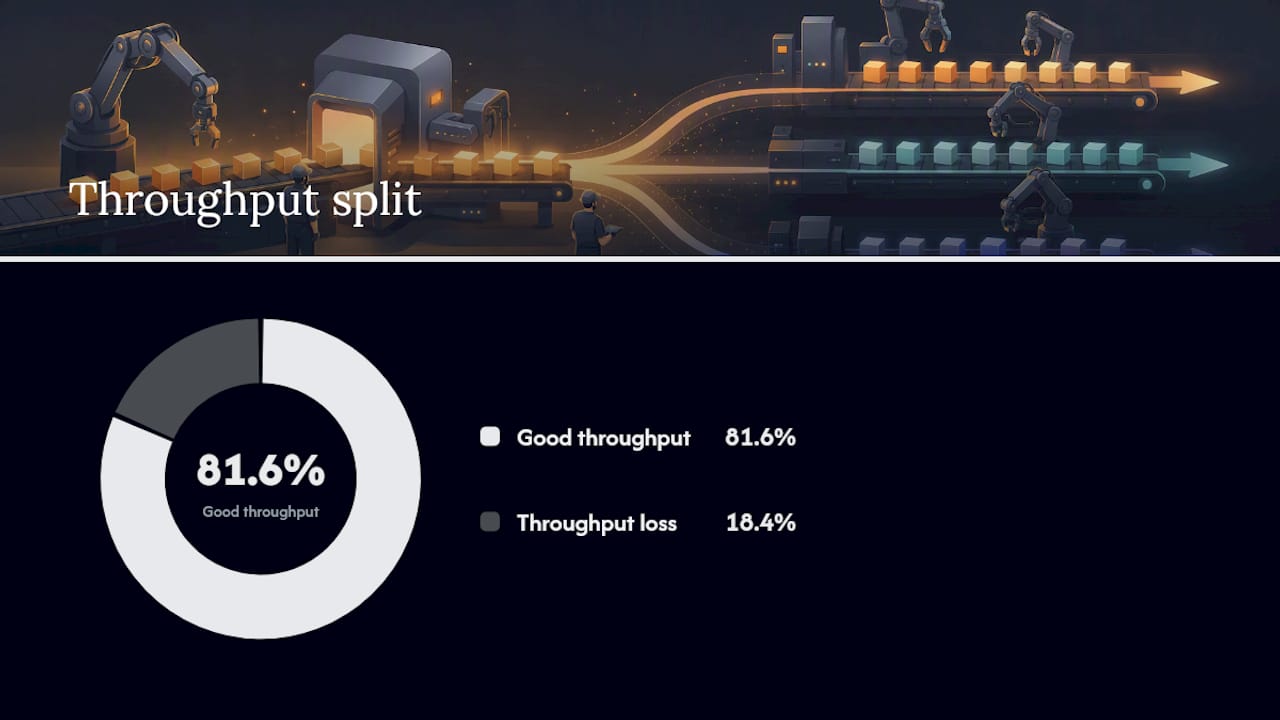
Say a machine rated at 100 parts/hour runs for a 10-hour shift. Gross capacity was 1,000 units. Actual good throughput comes out closer to 816 units for the shift, once availability and yield losses stack.
That gap, roughly 18% in this example, is where most of the money leaks out of a production line, and it rarely shows up until someone actually does the math.
Key Formulas and a Worked Throughput Calculation
Three formulas cover almost every throughput question you’ll face on the floor:
- Gross rate = 3,600 ÷ cycle time in seconds
- Good rate = gross rate × uptime % × yield %
- Throughput = good units ÷ net available time
Here’s how that plays out with real numbers. A CNC turning cell runs a 36 second cycle time. Gross rate is 3,600 ÷ 36 = 100 parts per hour. Uptime for the shift runs at 88% (accounting for tool changes and a short unplanned stop), and first-pass yield sits at 96%. Good rate = 100 × 0.88 × 0.96 = 84.5 good parts per hour.
Scale that out to multiple shifts or days by multiplying the hourly good rate by the number of shifts or days accordingly, to estimate total good parts produced.
That’s the math you hand to a quoting team or a plant manager asking “can we hit this delivery date?”
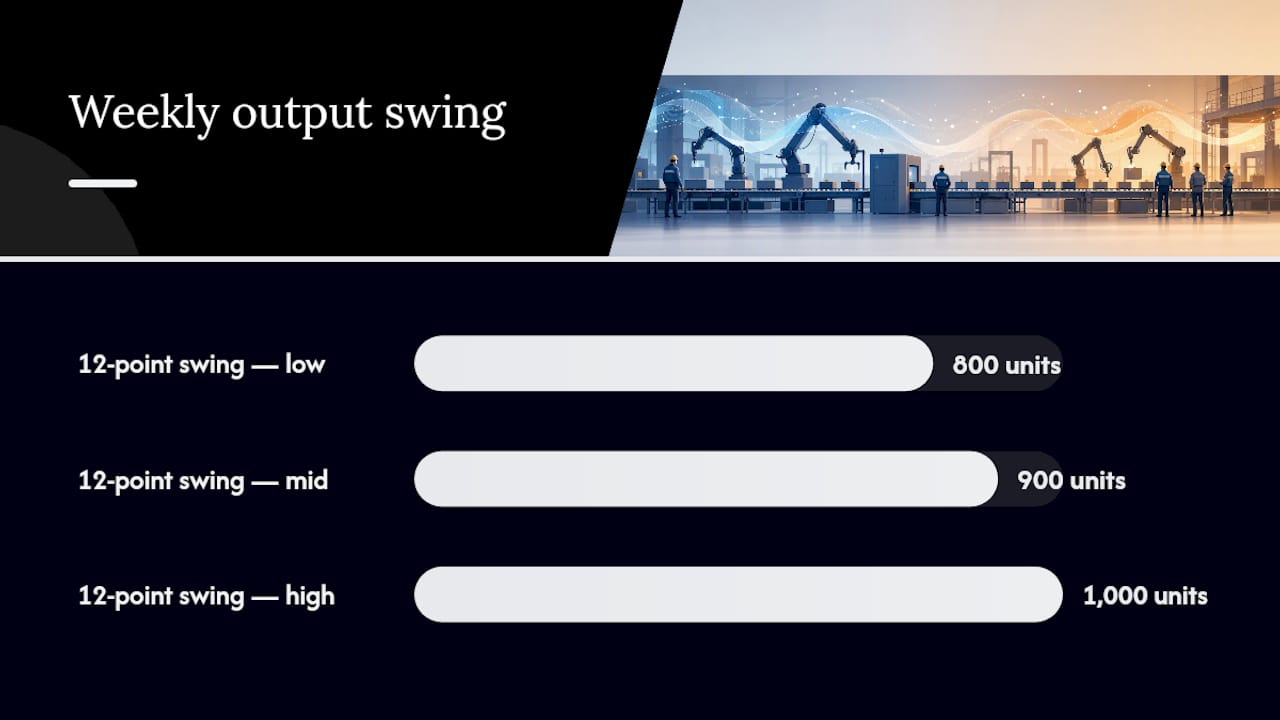
Statistic callout: A 12-point swing in combined uptime and yield, the difference between a well-run line and a struggling one, can swing weekly output by 800 to 1,000 units on a single cell. That’s the real cost of chasing gross speed instead of managed throughput.
Once you know throughput, Little’s Law gives you a fast sanity check on lead time: WIP = Throughput × Lead Time, rearranged as Lead Time = WIP ÷ Throughput. If you’re carrying 250 parts of WIP ahead of a station running 84.5 parts/hour, expected lead time through that station is just under 3 hours. Reduce WIP without touching throughput, and lead time drops proportionally.
Throughput vs. Cycle Time vs. Lead Time: What’s the Difference?
These three terms get used interchangeably, and that’s where planning mistakes start. Each answers a different question:
- Cycle time — how long one unit takes to complete one operation (answers “how fast is this station?”)
- Throughput — the rate of good units completed per unit time (answers “how many can we ship per hour?”)
- Throughput time — how long a single unit takes to move from start to finish across the whole process, as PTC explains it
- Lead time — the customer-facing clock, from order placement to delivery (answers “when does the customer get it?”)
Use cycle time to balance a line, throughput to plan capacity and quote volume jobs, and lead time to set delivery commitments. Confusing throughput with lead time is how sales teams over-promise on jobs a line physically can’t support. For a deeper look at how cycle time gets measured and tightened station by station, see how machining cycle times are optimized for precision work.
Which KPIs Should You Track Alongside Throughput?
Throughput doesn’t live in isolation. It’s the output of several supporting metrics working together, and OEE breaks those into three components: availability, performance, and quality.
- OEE (Overall Equipment Effectiveness) — the multiplied score of the three components above
- Uptime — percentage of scheduled time the equipment actually ran
- First-pass yield — percentage of parts that pass inspection without rework
- Takt time — the pace needed to match customer demand
- WIP and lead time — inventory and duration measures tied together by Little’s Law
World-class OEE benchmarks tend to sit around 85%, though most job shops running mixed part families operate well below that. When uptime looks fine but throughput still lags, the shortfall usually traces back to changeover time or quality loss, not the machine itself. A line running at 95% uptime but only 70% yield is losing far more capacity to rework than to downtime, and that’s an easy trap to miss if you only watch the uptime number.
What Factors Reduce or Increase Delivered Throughput?
Several recurring culprits explain most throughput gaps between plan and actual:
- Bottlenecks — one slow or unreliable station capping the whole line’s output
- Unplanned downtime — breakdowns, jams, and unscheduled maintenance
- Long changeovers — time lost switching between part numbers or tooling setups
- Low yield and rejects — scrap and rework quietly consuming capacity that never shows up as “downtime”
- Material flow and queueing — starved or blocked stations waiting on upstream or downstream work
- Staffing variability — skill gaps or absenteeism slowing specific operations
- Poor scheduling — sequencing that forces excess changeovers or idle machine time
These interact. A quality problem sitting right at your bottleneck operation is worse than the same defect rate anywhere else on the line, because every rejected part at the constraint steals throughput the rest of the system can never recover.
Pro Tip: The most overlooked cause of throughput loss isn’t downtime or scrap. It’s counting reworked parts as “good” in your tracking system. That inflates your numbers on paper while the constraint quietly starves your real output.
How Do You Actually Improve Manufacturing Throughput?
Start by finding the constraint, not by speeding up everything at once. Theory of Constraints logic is blunt about this: improving a non-bottleneck station does nothing for overall throughput if the bottleneck is still capping output downstream.
- Identify the constraint. Look for the station with the largest queue in front of it or the longest average wait time.
- Protect it. Never starve the bottleneck. Buffer inventory ahead of it if needed.
- Reduce unplanned downtime on the constraint first, through preventive maintenance scheduled around production windows rather than reactive fixes.
- Shorten changeovers using SMED principles, particularly at the constraint operation.
- Improve yield with SPC and root-cause analysis focused specifically on constraint-station defects.
- Add capacity elsewhere only if it feeds the constraint more reliably. Speeding up a non-bottleneck step just moves the queue.
Quick wins (changeover reduction, maintenance scheduling) usually beat capital projects for near-term ROI. Track progress with a visual daily throughput board at the constraint station, reviewed every shift, not just monthly. Automation and better line monitoring can sustain throughput gains once you’ve fixed the underlying constraint, but automation applied to the wrong station just makes the bottleneck run faster into a wall.
How Should You Measure Throughput in Your Plant?
Reliable throughput reporting starts with consistent data collection, not spreadsheets built after the fact.
- Set a release gate. Define the exact point a part counts as “good” (typically post-inspection).
- Log timestamped completions at that gate, every shift.
- Track downtime events separately as planned or unplanned.
- Record scrap counts and cycle times per operation.
- Capture changeover durations by part number.
Report on a rolling cadence: shift-level for immediate response, daily for trend-spotting, and a rolling 7-day average to smooth out noise. Always calculate against net available time, excluding scheduled breaks and planned maintenance windows, not full clock time.
A useful shift report includes these columns: unit count, good units, net available time, throughput (units/hour), uptime %, and yield %.
- Unit count and good units side by side (to expose rework immediately)
- Uptime % and yield % (to diagnose where losses come from)
- Throughput trend versus the prior 7-day average
Lessons From High-Volume Precision Machining
Machining Technologies has run precision, high-volume production since 1985, operating a 70,000 square foot facility in Webster, Massachusetts equipped with Hydromat systems, CNC milling and turning centers, and wire EDM, producing over 20 million parts annually across aerospace, defense, and firearms components. Running at that scale for four decades teaches a few hard lessons about throughput that don’t show up in textbooks.
Protecting the bottleneck matters more than any single machine upgrade. On a Hydromat line running multiple spindles simultaneously, a single misaligned station can quietly cap the output of the entire cell, no matter how fast the other stations run.
-
Scheduled maintenance windows, planned around production cycles rather than calendar dates, keep unplanned downtime from stealing the gains an automation upgrade just delivered.
-
Automation sustains throughput consistency at high volume, but only once the constraint station is identified and protected first.
-
First-pass yield tracking at the constraint step catches stolen throughput before it shows up as a missed delivery date.
Readers evaluating whether to bring high-volume production in house or outsource it can review Machining Technologies’ precision parts manufacturing services for context on how throughput and quality control work together at scale.
What Most Plants Get Wrong About Throughput
The conventional advice on throughput fixates on speed: run the machine faster, cut cycle time, buy a newer spindle. That advice usually misses the actual leak. In every high-volume shop I’ve seen discussed in the data behind this piece, the real throughput loss sits in yield and changeover time, not raw cycle speed.
The bigger mistake is treating throughput as a plant-wide average instead of a constraint-specific number. Averaging throughput across ten stations tells you almost nothing about where your next dollar of improvement should go. Find the one station actually capping your output, and ignore the temptation to “optimize” everything else first.
If you take one thing from this: measure yield and downtime at the bottleneck before you touch anything else. Everything downstream of that decision, maintenance schedules, automation investment, changeover projects, should be prioritized by how much they protect that one station’s output.
Sources
- Throughput Or Production Rate | IEEE Technology Navigator
- Throughput Formula | MFG Calcs
- What Is Manufacturing Throughput? | PTC
- Little’s Law in Manufacturing: WIP, Throughput, Lead Time
- 6 ways to improve manufacturing throughput | ASCM
Recommended
- High-volume manufacturing examples: strategies explained | Machining Technologies
- Defining Rapid Turnaround in Manufacturing: 2026 Guide | Machining Technologies
- Maximize output and quality: Top benefits of automated manufacturing | Machining Technologies
- High-Volume Manufacturing Benefits for Precision Parts | Machining Technologies