
Quality assurance protects revenue, prevents defects before they reach customers, and sustains the brand trust that keeps contracts coming back. Industry research estimates COPQ typically consumes 10–30% of annual revenue for many manufacturers, while world-class operations with mature quality systems drive that figure below 5%. That gap is the financial case for QA in a single sentence. Two things close it: leadership commitment to treating quality as a system, not a department, and a baseline measurement of your current cost of poor quality (COPQ) so you know exactly where you stand.
Key actions to take now:
- Calculate your COPQ baseline this quarter — scrap and rework are only the visible tip.
- Appoint cross-functional owners for prevention, not just inspection.
- Align your QA program with ISO 9001 as the governing management-system standard.
Key Takeaways
| Point | Details |
|---|---|
| COPQ is the business case | COPQ typically runs 10–30% of revenue; world-class operations get it to a much lower level — measure yours first. |
| Prevention beats inspection | Shifting spend toward FMEA, SPC, and supplier qualification reduces total COPQ more than adding inspection headcount. |
| Standards provide governance | ISO 9001 gives your QA program auditable structure; AS9100 and IATF 16949 are required for aerospace and automotive supply chains. |
| Leadership ownership is non-optional | QA programs that report to a quality department alone fail; COPQ must appear on the same dashboard as revenue and margin. |
| Start with a COPQ baseline | Run a COPQ calculation this quarter — including hidden costs — and present it to finance as a recoverable margin opportunity. |
Table of Contents
- What does quality assurance actually cover?
- QA vs. quality control: what’s the practical difference for leaders?
- Why quality assurance is important for business outcomes
- Core QA methods and best practices leaders should adopt
- Which standards and certifications actually matter for QA?
- A practical six-step QA plan you can start this quarter
- Measuring QA impact: KPIs, COPQ, and the PAF model
- How QA works in precision machining: a Machining Technologies LLC example
- An executive perspective on where most QA programs fail
- Machiningtechllc: QA-backed precision machining for OEMs
- Sources
What does quality assurance actually cover?
ISO frames quality assurance as a proactive management-system approach — a set of planned, systematic activities designed to provide confidence that quality requirements will be met across the entire value chain, not just at the end of the line. That distinction matters because most organizations that struggle with quality are running reactive inspection programs and calling them QA.
A genuine QA system spans every stage where a defect can be introduced or prevented:
- Process design and control: Documented standard operating procedures (SOPs), process capability studies, and statistical process control (SPC) that catch drift before it produces scrap.
- Supplier qualification: Formal approval of suppliers before production, with ongoing monitoring and requalification to prevent drift after onboarding.
- Documentation and records: Controlled documents, revision histories, and traceability records that support audits and corrective actions.
- Internal and external audits: Scheduled reviews that verify the system is working, not just that paperwork exists.
- Corrective and preventive action (CAPA): Structured root-cause analysis and verified fixes that close the loop on failures.
- Training and competency management: Ensuring the people running processes understand what “good” looks like and why it matters.
The scope is broad by design. A defect that escapes to a customer is almost always traceable to a gap in one of these areas, not to a single bad operator.
QA vs. quality control: what’s the practical difference for leaders?
ASQ defines the distinction clearly: QA is the planned, systematic activities that provide confidence requirements will be fulfilled; QC is the operational techniques used to actually fulfill them. Put plainly, QA prevents defects and QC finds them. Both are necessary, but they serve fundamentally different roles in your operation.
Think of it this way. QA is the engineering of your process so that a defect is unlikely to occur. QC is the inspection that catches one when it slips through anyway. Organizations that invest only in QC are paying to find problems they could have avoided. The cost compounds fast — a defect caught at final inspection costs far more to fix than one prevented at the design or process-control stage.
Concrete examples of each:
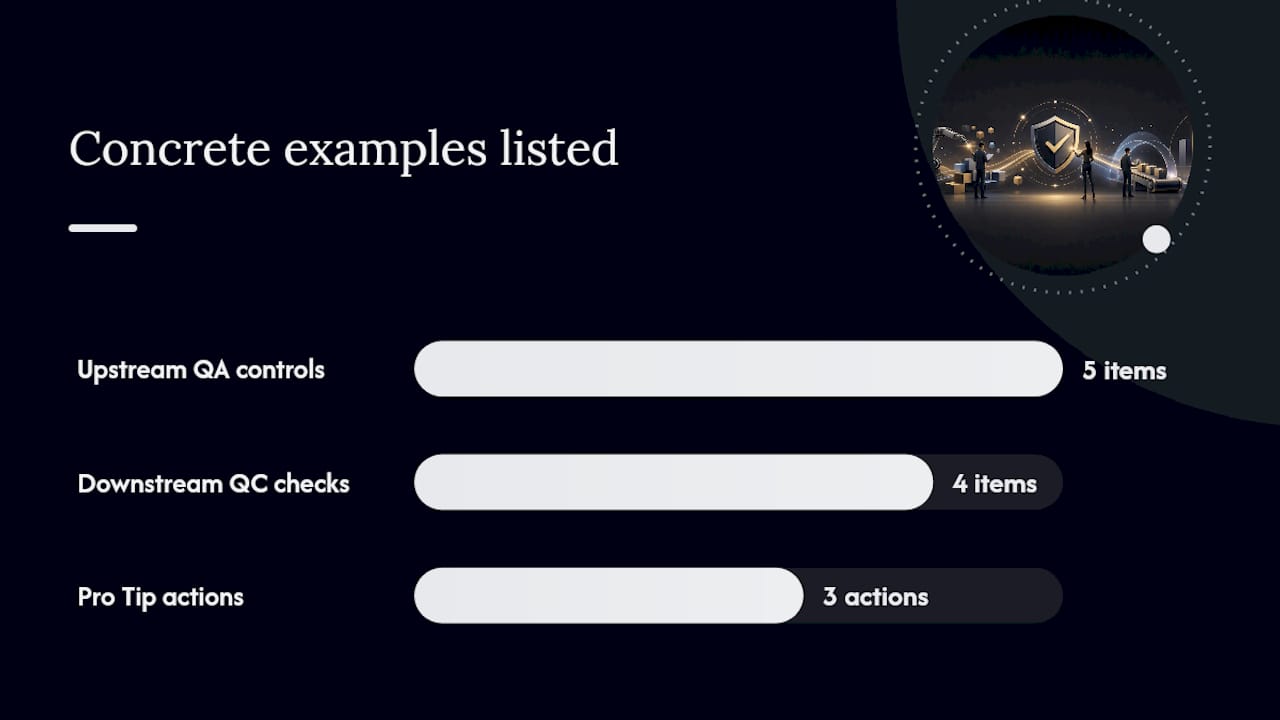
- Upstream QA controls: Supplier qualification audits, design-for-manufacturability (DFM) reviews, process FMEA before production launch, SPC limits on critical dimensions, and operator training on setup verification.
- Downstream QC checks: Incoming inspection of purchased material, in-process dimensional checks, final inspection against drawing tolerances, and functional testing before shipment.
Pro Tip: When your defect rate is high, the instinct is to add more inspection. That rarely works long-term. Use a Pareto chart to identify the top three failure modes, then trace each one upstream to its root cause. Invest in prevention there — process controls, supplier qualification, or design changes — and your QC burden drops on its own.
The cost of poor quality framework makes this concrete: every dollar spent on prevention typically saves several dollars in failure costs. Leaders who understand that ratio stop treating inspection headcount as their primary quality lever.
Why quality assurance is important for business outcomes
The importance of quality assurance shows up most clearly on the income statement and in customer retention data. Here is what a mature QA program actually delivers:
Reduced cost of poor quality. COPQ typically runs 10–30% of revenue for manufacturers without mature quality systems. The difference between typical and best-in-class levels represents a substantial recoverable margin on a multimillion-dollar revenue base. That is not a quality metric — that is a P&L line.
Customer satisfaction and retention. Defects that reach customers generate warranty claims, returns, and complaints. More damaging is the customer who says nothing and simply does not reorder. QA reduces the defect rate that drives both outcomes. Peer-reviewed evidence across sectors confirms that systematic quality improvement programs deliver measurable gains in customer-facing outcomes.
Compliance and market access. Regulated industries — aerospace, defense, medical devices, firearms — require documented quality systems as a condition of doing business. ISO 9001 certification, AS9100 for aerospace, and IATF 16949 for automotive are not optional for suppliers in those supply chains. QA is the mechanism that keeps you compliant and keeps your contracts.
Speed to market and capacity. Every hour spent on rework, firefighting, and re-inspection is capacity that cannot be used for production. A mature QA program reclaims that capacity. Manufacturing QA roadmaps show documented outcomes of 20–35% lower defect rates and first-pass-yield improvements when QA is integrated and digitized — which translates directly into faster ramp times and higher throughput on the same equipment.
Supplier stability and reduced supply risk. Supplier failures are one of the most common sources of production disruption. A lifecycle-based supplier qualification program — initial approval, ongoing monitoring, requalification — reduces the probability of a supplier-caused line stop. That stability compounds over time into a more predictable supply chain and a stronger negotiating position with buyers who value reliability.
Lower warranty exposure. Warranty costs are a direct hit to margin, and they arrive late — often quarters after the defect was introduced. Prevention-focused QA reduces field failure rates, which reduces warranty accruals and the engineering firefighting that consumes your best technical people.
The hidden costs are where most finance teams undercount. ASQ’s cost-of-quality guidance identifies engineering firefighting, lost capacity, and customer attrition as the components organizations most frequently miss when calculating their true COPQ.
Core QA methods and best practices leaders should adopt
No single method covers everything. The strongest QA programs layer several frameworks and tools, each addressing a different part of the quality system.
Named methods worth funding
ISO 9001 is the foundation. It provides the management-system structure — documented processes, internal audits, management review, and continual improvement — that everything else runs on. Without it, other methods lack governance.
Six Sigma is a data-driven methodology for reducing process variation. Its DMAIC cycle (Define, Measure, Analyze, Improve, Control) gives teams a structured path from problem identification to verified solution. It works best on chronic, high-cost defect problems where the root cause is not obvious.
Total Quality Management (TQM) is the cultural and organizational framework. Where Six Sigma is a project methodology, TQM is a philosophy: every function, every employee, and every supplier is part of the quality system. It requires visible leadership commitment to work — which is why it fails in organizations where quality is delegated entirely to the quality department.
PDCA (Plan-Do-Check-Act) is the continuous improvement engine underneath most QA programs. It is simple enough to run at the shop-floor level and rigorous enough to drive systemic change when applied consistently.
FMEA (Failure Mode and Effects Analysis) is the upstream risk tool. Run before production launch, it forces cross-functional teams to identify what can go wrong, how likely it is, and how severe the impact would be — then prioritize prevention investments accordingly.
SPC (Statistical Process Control) monitors process output in real time using control charts. When a process drifts toward its control limits, SPC signals the problem before defects are produced. It is one of the highest-ROI tools in precision manufacturing.
CAPA (Corrective and Preventive Action) closes the loop. A CAPA system without effectiveness verification is just paperwork. The check that matters is whether the failure mode recurred after the corrective action was implemented.
Operational best practices
- Qualify suppliers formally before production, then monitor them continuously — not just at onboarding.
- Use stage-gate controls at new product introduction (NPI) to prevent unresolved design or process risks from entering production.
- Validate your measurement systems (MSA/Gauge R&R) before trusting the data your QC checks generate.
- Set an audit cadence — internal audits quarterly, supplier audits annually at minimum for critical sources.
- Document SOPs at the level of detail where a trained operator can execute them consistently without interpretation.
Technology enablers
A digital quality management system (QMS) replaces spreadsheets and paper-based records with searchable, auditable, version-controlled documentation. SPC dashboards surface process drift in real time. Automated inspection — coordinate measuring machines (CMMs), vision systems, laser scanning — removes operator subjectivity from dimensional verification. Closed-loop CAPA workflows track corrective actions from initiation to verified effectiveness.
Pro Tip: The most common QA failure is treating quality as a department rather than a system. Embed QA responsibilities into production, engineering, procurement, and supplier management roles. The quality team should own the system design and governance — not be the only people responsible for quality outcomes.
Engineering guidance integrated with QA processes is one of the most underused levers in manufacturing organizations. When engineering controls are designed with quality requirements in mind from the start, the downstream inspection burden drops significantly.
Which standards and certifications actually matter for QA?
Standards give your QA program external credibility and internal structure. The right ones depend on your industry, but a few are worth understanding regardless of sector.
ISO 9001 is the global baseline. It specifies requirements for a quality management system and is applicable to any organization, regardless of size or industry. Certification demonstrates that your organization has a documented, audited, and continually improving quality system — not just that your products passed inspection. For OEM suppliers and contract manufacturers, ISO 9001 certification is frequently a minimum requirement to be considered for a contract.
ISO 9001 certification signals to customers and regulators that quality is managed systematically — through documented processes, management review, and verified corrective actions — rather than through end-of-line inspection alone. That distinction is what buyers are actually evaluating when they ask for your quality certifications.
AS9100 extends ISO 9001 for the aerospace and defense supply chain, adding requirements for configuration management, risk management, first-article inspection, and counterfeit-part prevention. If you supply aerospace OEMs, AS9100 is effectively mandatory. Aerospace machining best practices align directly with AS9100 requirements, particularly around process controls and traceability.
IATF 16949 is the automotive equivalent, adding requirements for advanced product quality planning (APQP), production part approval process (PPAP), and measurement system analysis (MSA). Automotive supply chains enforce it rigorously.
How standards fit into a practical QA program:
- They provide the audit framework that keeps your system honest.
- They require top-management commitment as a documented requirement, not an aspiration.
- They drive documentation discipline that pays off during customer audits and regulatory reviews.
- Certification is a market differentiator when your buyers are evaluating supplier risk — it shifts the conversation from “trust us” to “here is the evidence.”
BIAX’s ISO 9001 certification resource provides a useful reference for understanding what the certification process demonstrates and what auditors actually evaluate.
A practical six-step QA plan you can start this quarter
Implementation does not require a multi-year transformation program. These six steps give you a prioritized, resource-light path from baseline to a functioning QA system.
-
Baseline your COPQ and current KPIs. Before spending anything on prevention, measure where you are. Calculate scrap, rework, warranty, and inspection costs. Then estimate hidden costs: engineering time on firefighting, expediting, customer complaints, and lost orders. This number is your starting point and your business case.
-
Identify your highest-cost failure modes. Run a Pareto analysis on your defect data to find the 20% of failure modes driving 80% of your COPQ. For each top failure mode, run a simplified FMEA to identify root causes and prioritize by severity and frequency. This step tells you where prevention investment will pay off fastest.
-
Set prevention investments and assign accountable owners. For each prioritized failure mode, define the prevention control — a process change, a supplier qualification requirement, an SPC limit, a design modification — and assign a named owner with a deadline. Prevention without ownership is a wish list.
-
Implement controls and a digital QMS. Deploy the prevention controls identified in step 3. Simultaneously, move your quality documentation, CAPA records, and audit schedules into a digital QMS. Paper-based systems cannot scale and cannot be audited efficiently. A manufacturing quality assurance checklist is a useful tool for structuring this implementation phase.
-
Run CAPA and verify effectiveness. For every corrective action implemented, schedule an effectiveness check 30–90 days out. Did the failure mode recur? Did the KPI improve? If not, the root cause analysis was incomplete. Effectiveness verification is what separates a real CAPA system from a documentation exercise.
-
Review, govern, and scale. Establish a monthly or quarterly quality review cadence at the leadership level. Review COPQ trends, KPI performance, audit findings, and CAPA status. Use this forum to approve resource allocation for the next cycle of prevention investments. This governance step is what keeps the system from reverting to reactive firefighting after the initial push.
Executive QA kickoff checklist:
- COPQ baseline calculated and presented to finance
- Top five failure modes identified by Pareto analysis
- Prevention owners named and accountable
- Digital QMS selected and implementation timeline set
- Audit schedule established (internal and supplier)
- Quality KPI dashboard visible to leadership monthly
Measuring QA impact: KPIs, COPQ, and the PAF model
You cannot manage what you do not measure. These are the metrics that tell you whether your QA program is working and give you the data to justify continued investment.
Primary KPIs to track
- Defect rate / PPM (parts per million): The baseline measure of process quality. Track by product line, process, and supplier.
- First-pass yield (FPY): The percentage of units that complete the production process without rework or rejection. A direct measure of process capability.
- Right-first-time rate: Similar to FPY but measured at each process step, not just final output.
- COPQ as a percentage of revenue: The board-level metric. Track prevention, appraisal, internal failure, and external failure costs separately.
- CAPA effectiveness rate: The percentage of corrective actions that successfully prevent recurrence. Anything below 80% indicates root-cause analysis is not going deep enough.
- Supplier PPM: Defects per million units received from each supplier. Drives supplier qualification decisions.
- Customer complaint and RMA rate: The customer-facing measure of quality. Lags the internal metrics but is the one that directly affects revenue.
The PAF model and why shifting spend to prevention pays
ASQ’s cost-of-quality framework organizes COPQ into three buckets: Prevention (training, process design, FMEA, supplier qualification), Appraisal (inspection, testing, audits), and Failure (internal: scrap, rework; external: warranty, returns, customer attrition). Most organizations spend the majority of their quality budget on appraisal and failure. The PAF model shows that shifting even a fraction of that spend toward prevention reduces total COPQ significantly, because prevention eliminates the defects that appraisal and failure costs are responding to.
| COPQ Category | Examples | Typical Undercount Risk |
|---|---|---|
| Prevention | FMEA, SPC setup, supplier qualification, training | Low — usually tracked |
| Appraisal | Inspection labor, CMM time, audit costs | Medium — often partial |
| Internal failure | Scrap, rework, re-inspection, downtime | Medium — visible but incomplete |
| External failure | Warranty, returns, expediting, customer attrition | High — attrition rarely counted |
Industry guides confirm that visible scrap is frequently a small fraction of total COPQ. Finance teams that benchmark quality cost against scrap alone are systematically underestimating the problem and, consequently, underinvesting in prevention.
Lean and PDCA-aligned COPQ reduction frameworks recommend a four-stage approach: baseline measurement, Pareto/FMEA prioritization, targeted prevention investment, and remeasurement to verify ROI. That sequence maps directly to the six-step plan above.
How QA works in precision machining: a Machining Technologies LLC example
Precision contract manufacturing is one of the most demanding QA environments that exists. Tolerances measured in ten-thousandths of an inch, materials that behave differently across production runs, and customers in aerospace, defense, and firearms manufacturing who cannot accept field failures — the stakes are high and the margin for error is narrow.
At Machiningtechllc, QA is embedded at every stage of the production process across a 70,000-square-foot facility producing over 20 million parts annually. The approach follows the prevention-first logic the PAF model prescribes.
Supplier qualification is lifecycle-based: formal approval before a supplier enters the supply chain, ongoing performance monitoring against PPM targets, and requalification when performance drifts or a supplier changes a process. Contract manufacturing QA guidance confirms this lifecycle approach is what separates suppliers who maintain quality from those who pass initial audits and then drift.
Stage-gate NPI controls prevent unresolved design or process risks from entering production. Before a new part moves from prototype to volume production, it passes through defined checkpoints: first-article inspection, process capability verification, and documented approval from quality and engineering. No gate opens without evidence.
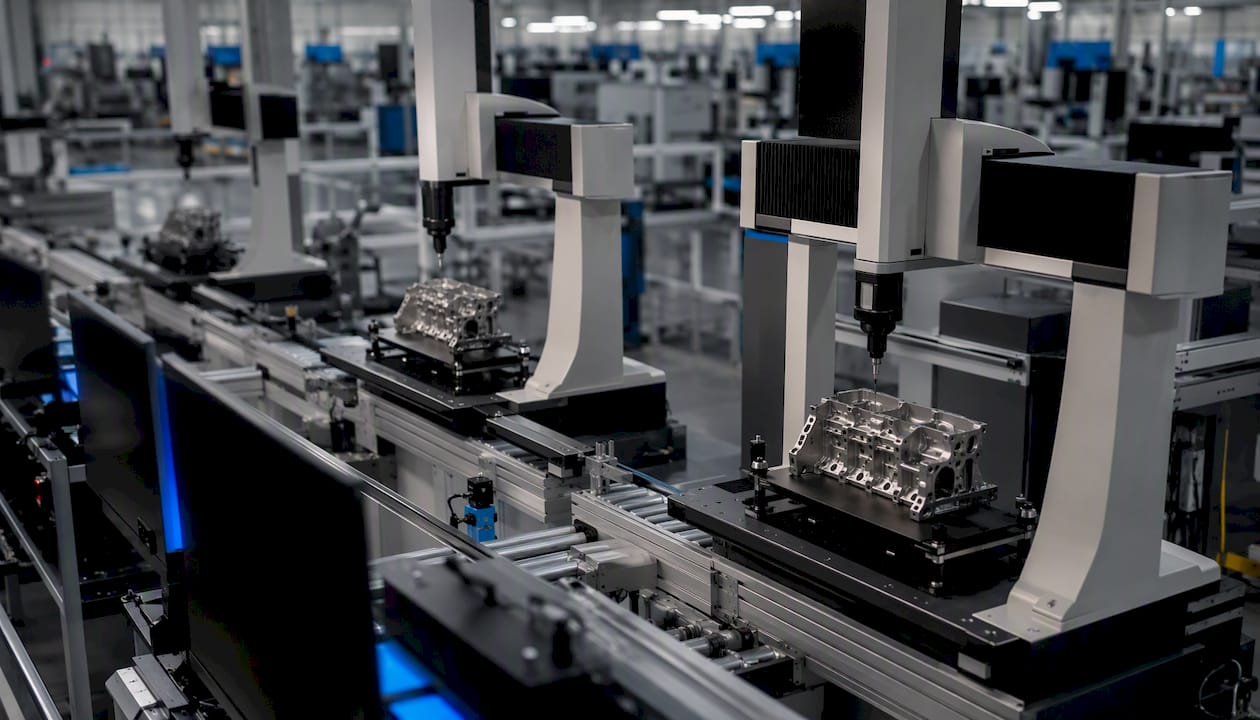
In-process SPC monitors critical dimensions on Hydromat, CNC milling, turning, and wire EDM operations in real time. When a dimension trends toward a control limit, the system flags it before a defect is produced — not after. Verifying machined part quality at this level requires validated measurement systems, not just capable machines.
The outcomes are measurable: reduced defect rates, faster production ramp on new programs, and lower warranty exposure for customers who depend on Machiningtechllc as a supply-chain partner.
In contract manufacturing, the quality system is the product. Customers are not just buying machined parts — they are buying confidence that every part in a run of 500,000 meets the same specification as the first-article sample. That confidence comes from the system, not from end-of-line inspection.
Pro Tip: In contract manufacturing, blame cycles during troubleshooting waste more time than the defects themselves. Machiningtechllc uses pre-defined stop-go rules — documented measurement methods, evidence requirements, and decision criteria — so that when a quality issue arises, the conversation starts with data, not with finger-pointing. That structure resolves problems faster and preserves the customer relationship.
Key QA proof points at Machiningtechllc:
- Hydromat high-volume machining with in-process SPC on critical features
- Formal supplier qualification with lifecycle monitoring
- Stage-gate NPI process with first-article inspection and capability verification
- Quality control best practices applied across CNC milling, turning, and wire EDM operations
- Firearms component QA with traceability and compliance documentation for regulated applications
An executive perspective on where most QA programs fail
The gap between organizations that get real ROI from QA and those that do not is almost never about methodology. It is about where quality sits in the organizational hierarchy and who owns it.
When quality is a department rather than a system, the quality manager becomes the person responsible for problems that engineering, procurement, and production created. That structure produces two predictable outcomes: the quality team is chronically understaffed relative to the firefighting load, and the root causes of defects never get addressed because the functions that own those processes do not feel accountable for quality outcomes.
COPQ appears on the same dashboard as revenue and margin. Supplier PPM is reviewed in the same meeting as on-time delivery. First-pass yield is a KPI that production leadership is held to, not just the quality team.
Three priorities for any executive serious about closing the COPQ gap:
- Baseline COPQ this quarter — including hidden costs — and present it to the board as a recoverable margin opportunity, not a quality report.
- Shift budget toward prevention. If your quality spend is weighted toward inspection and failure response, reallocate 20–30% toward FMEA, supplier qualification, and SPC. The PAF model predicts the payoff.
- Govern with KPIs and monthly reviews. Quality improvement without governance reverts. A monthly leadership review of COPQ, FPY, and CAPA effectiveness is the mechanism that sustains progress.
The cultural requirement is simple to state and hard to execute: quality must be a cross-functional responsibility with visible leadership commitment. Without that, every methodology in this article is just a training exercise.
Machiningtechllc: QA-backed precision machining for OEMs
If your supply chain depends on high-volume, tight-tolerance components in aerospace, defense, firearms, or industrial applications, the quality system behind your contract manufacturer is as important as the equipment they run.
Machiningtechllc has operated from Webster, Massachusetts since 1985, producing over 20 million parts annually across Hydromat, CNC milling and turning, and wire EDM operations — all within a 70,000-square-foot facility built for high-volume precision work. Every program runs under a documented QA system with in-process SPC, lifecycle supplier qualification, and stage-gate NPI controls.
Explore contract machining benefits for OEMs or review precision machining services to scope your next program.
Sources
These sources support the claims in this article and provide deeper material for governance documentation, budget requests, and QA program design.
The sources below span standards bodies, peer-reviewed research, and practitioner frameworks. Use them together: ISO and ASQ for governance language, PMC for cross-sector evidence, and the practitioner guides for calculation templates and implementation roadmaps.
- ISO 9001 — Quality management
- The Importance of Quality Assurance and Quality Improvement in Low- and Middle-Income Settings
- Quality assurance vs control | ASQ
- The Cost of Poor Quality (COPQ) in Manufacturing: 2026 Guide | Fabrico
Recommended
- Achieve Consistent Quality Assurance in Firearms Parts | Machining Technologies
- How to Ensure Component Quality in Manufacturing | Machining Technologies
- Quality Control Best Practices for Manufacturing Pros | Machining Technologies
- How to verify machined part quality: methods for aerospace OEMs | Machining Technologies