


TL;DR:
- Rapid manufacturing turnaround emphasizes reducing queue, setup, and communication delays instead of machine speed. Focusing on queue time, applying SMED, controlling work release, and tracking few KPIs significantly shorten lead times. Effective production relies on preparation, digital data integration, and disciplined scheduling to eliminate hidden delays.
Rapid turnaround in manufacturing is defined as the systematic reduction of total lead time from order initiation to delivery, eliminating non-value-added delays while maintaining quality and output. The industry now treats this not as a simple speed target but as an operational velocity philosophy that treats time as a protected resource. Defining rapid turnaround in manufacturing requires separating three distinct terms: turnaround time (total elapsed time from order to shipment), lead time (time from order receipt to delivery), and cycle time (time to complete one unit). Confusing these terms leads to misaligned targets and wasted improvement effort. Machiningtechllc has built its production model around this distinction, producing over 20 million parts annually with on-time delivery as a core commitment.
What are the main components of turnaround time in manufacturing?
Turnaround time is not one number. It is the sum of queue time, setup time, processing time, inspection time, and move time. Understanding which component dominates is the first step toward meaningful improvement.

Queue time dominates lead time, accounting for 80–90% of total elapsed time in most production environments. That figure surprises most manufacturing professionals who assume machine speed is the primary constraint. Speeding up a CNC spindle by 10% saves minutes. Cutting queue time by 30% saves days.
The key components of turnaround time include:
- Queue time: Time a job waits before processing begins. This is the largest and most addressable delay.
- Setup and changeover time: Time lost between production runs. Excessive changeovers compound across a full shift.
- Processing time: Actual machine cutting or forming time. This is typically the smallest share of total lead time.
- Move and inspection time: Transfer between workstations and quality checks. Often underestimated in scheduling.
- Work-in-process (WIP) congestion: Too many jobs released simultaneously creates bottlenecks that extend every job’s wait.
Operational velocity is the concept that separates high-performing shops from average ones. A facility can run fast machines and still deliver late if WIP clogs the floor and jobs sit idle between operations. The real constraint is the flow of work through the system, not the speed of any single machine.
Pro Tip: Map your floor’s actual queue time for one week before investing in faster equipment. The data almost always shows that scheduling and WIP control will deliver faster results than hardware upgrades.
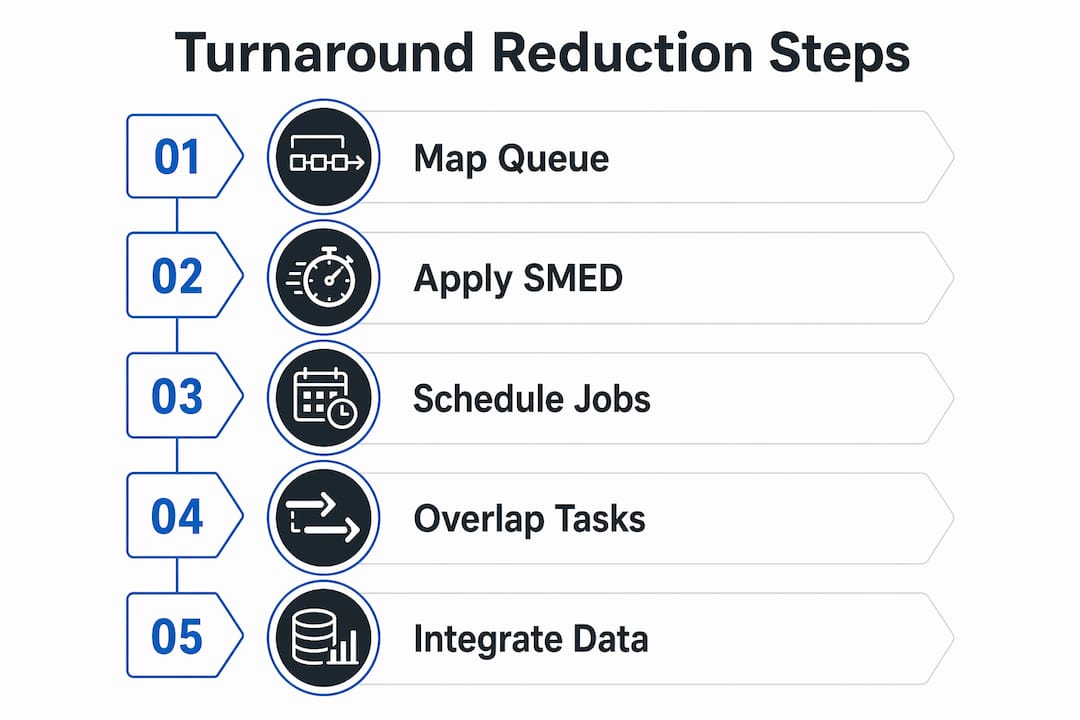
Which strategies effectively reduce turnaround time in production?
The most proven methods for reducing turnaround time combine setup reduction, scheduling discipline, and digital data integration. Each addresses a different layer of delay.
1. Apply SMED to cut changeover time
SMED (Single-Minute Exchange of Die) is a methodology that targets setup time as a primary source of lost production time. SMED reduces changeover time by converting internal setup tasks (done while the machine is stopped) into external tasks (done while the machine is still running). The result is changeovers measured in minutes rather than hours.
2. Use finite capacity scheduling and controlled work release
Finite capacity scheduling only releases jobs to the floor when the required resources are actually available. Controlled work release prevents WIP from accumulating at bottleneck stations, which is the primary cause of queue time inflation. Releasing fewer jobs at once keeps the floor moving faster overall.
3. Apply overlap scheduling and optimized job sequencing
Overlap scheduling starts the next operation before the previous one finishes the full batch. This cuts total elapsed time without adding any equipment. Job sequencing groups similar setups together to minimize changeover frequency across a shift.
4. Integrate digital data across machines and departments
Unified digital integration across machines, maintenance systems, and production plans eliminates the communication gaps that silently extend lead times. When scheduling, maintenance, and quality data live in separate systems, delays multiply at every handoff.
Pro Tip: Start SMED by filming one complete changeover. Most teams discover 40–60% of their setup time is spent searching for tools or waiting for approvals. These are external tasks that can be prepared in advance.
The table below compares the primary strategies by impact area and implementation complexity.
| Strategy | Primary impact | Implementation complexity |
|---|---|---|
| SMED | Changeover time reduction | Moderate |
| Finite capacity scheduling | Queue time and WIP reduction | High |
| Overlap scheduling | Batch elapsed time reduction | Low |
| Digital data integration | Communication delay elimination | High |
| Job sequencing | Setup frequency reduction | Low |
Implementing SMED and controlled work release together reduces manufacturing lead times by 30–50%, with changeover times dropping 40–60%. That combination delivers the fastest measurable return of any single improvement program.
What KPIs best measure rapid turnaround effectiveness?
Measuring turnaround improvement requires a focused set of metrics. Tracking too many KPIs at once produces unreliable data and disengages the teams responsible for hitting targets.
Five KPIs define rapid turnaround performance: Overall Equipment Effectiveness (OEE), On-Time Delivery, First Pass Yield, Schedule Adherence, and Cycle Time. Each targets a different failure mode in the production system.
| KPI | Target threshold | What it measures |
|---|---|---|
| OEE | 85%+ | Combined availability, performance, and quality |
| On-Time Delivery | 95%+ | Schedule reliability from order to shipment |
| First Pass Yield | 95%+ | Quality rate without rework |
| Schedule Adherence | 95%+ | Accuracy of production plan execution |
| Cycle Time | At or below standard | Speed of individual operation completion |
OEE is the most comprehensive single metric for turnaround health. A score below 85% signals that availability losses (downtime), performance losses (slow running), or quality losses (defects) are consuming productive time. On-Time Delivery is the customer-facing result of all internal improvements combined.
Launching too many KPIs simultaneously degrades data quality and team engagement. The recommended approach is to start with 3–5 metrics, build reliable data collection around them, and add metrics only after the first set shows consistent results. Machiningtechllc’s manufacturing efficiency approach reflects this discipline, prioritizing measurable output over metric volume.
Key principles for effective KPI tracking:
- Assign one owner per KPI to maintain accountability.
- Review metrics weekly, not monthly, so corrections happen before delays compound.
- Connect each KPI to a specific process step so teams know exactly where to act.
How does preparation versus execution affect turnaround time?
The most counterintuitive insight in manufacturing lead time reduction is this: execution is the smaller problem. Preparation is where most time is lost.
Rapid turnaround demands that roughly 80% of total effort focus on preparation: queue management, staging, and setup. Execution accounts for only 20% of the time opportunity. Queue and wait times routinely exceed 85–95% of total lead time, making preparation the highest-leverage target for any improvement program.
This ratio inverts the instinct of most production managers, who focus improvement energy on machine speed and operator pace. The preparation-to-execution ratio means that a job sitting in a queue for six hours before a 20-minute operation is a scheduling problem, not a machining problem.
Common pitfalls that extend turnaround time include overloading the floor with WIP, which creates artificial bottlenecks at every workstation. Excessive multitasking across jobs splits operator attention and increases error rates, which then adds rework time. Poor communication between engineering, scheduling, and the floor creates approval delays that no amount of machine speed can recover.
Shifting internal setup tasks to external preparation is the single highest-impact change most shops can make without capital investment. When tools, fixtures, and materials are staged before the machine stops, changeover time drops immediately. Lean machining principles formalize this approach into repeatable standard work.
Pro Tip: Create a pre-shift staging checklist for every job scheduled to run that day. Operators who start a shift with tools and materials already at the machine cut their first changeover time by 30–40% without any formal SMED training.
Key Takeaways
Rapid turnaround in manufacturing is achieved by targeting queue time and preparation delays, not machine speed, and tracking a focused set of KPIs that reflect the full production system.
| Point | Details |
|---|---|
| Queue time is the primary target | 80–90% of lead time is non-value-added wait time, making queue reduction the highest-impact opportunity. |
| SMED delivers fast, measurable results | Converting internal setup tasks to external preparation cuts changeover time by 40–60% without capital investment. |
| Limit KPIs to 3–5 initially | Tracking more metrics than teams can act on degrades data quality and reduces improvement momentum. |
| Preparation outweighs execution | Roughly 80% of turnaround improvement comes from staging, scheduling, and queue management, not faster machining. |
| Digital integration removes hidden delays | Unified data across machines, maintenance, and scheduling eliminates the communication gaps that silently extend lead times. |
What I’ve learned about rapid turnaround after years in precision manufacturing
The definition of rapid turnaround has shifted in ways that most production managers have not fully absorbed. Speed used to mean machine RPM and operator pace. The current understanding treats time itself as the constrained resource, and the job of every manager is to protect it from waste at every stage of the workflow.
What I find most telling is how rarely shops measure queue time directly. They track OEE and on-time delivery, but they do not map where jobs actually sit idle between operations. When you do that mapping, the numbers are uncomfortable. A job that takes 45 minutes of actual machining time can spend 18 hours waiting. That gap is the real turnaround problem.
The data overload trap is real. I have seen shops implement 20-metric dashboards that nobody reads by week three. The teams that consistently hit their turnaround targets pick three to five metrics, review them every week, and assign clear ownership. Simplicity is not a compromise. It is the mechanism that makes improvement stick.
Digital synchronization between scheduling, maintenance, and the floor is no longer optional for shops competing on lead time. Siloed systems create invisible delays that accumulate across every shift. The shops that connect these data streams gain a structural advantage that machine investment alone cannot replicate.
— Andrew
How Machiningtechllc supports rapid turnaround for precision manufacturers
Machiningtechllc operates a 70,000 square foot facility in Webster, Massachusetts, with Hydromat systems, CNC milling, CNC turning, and wire EDM running at high-volume capacity. The facility produces over 20 million parts annually, with on-time delivery built into every production commitment.
For OEMs and industrial manufacturers who need fast, reliable production, Machiningtechllc’s contract machining services are built around the same principles covered in this article: controlled WIP, disciplined scheduling, and preparation-first workflow. The company has served aerospace, defense, and industrial machinery clients since 1985. Manufacturers looking for high-volume production with consistent turnaround performance can request a quote directly through the Machiningtechllc website.
FAQ
What is rapid turnaround in manufacturing?
Rapid turnaround in manufacturing is the systematic reduction of total lead time from order start to delivery by eliminating non-value-added queue time, setup delays, and communication bottlenecks. It is now defined as an operational velocity discipline, not simply a measure of machine speed.
Why does queue time matter more than machine speed?
Queue and wait time account for 80–90% of total lead time in most production environments. Reducing queue time delivers faster results than increasing machine speed because it addresses the largest share of elapsed time.
What is SMED and how does it reduce turnaround time?
SMED (Single-Minute Exchange of Die) is a methodology that converts setup tasks done while a machine is stopped into tasks completed before the machine stops. This reduces changeover time by 40–60% and directly cuts total turnaround time between production runs.
How many KPIs should a manufacturer track for turnaround improvement?
Start with 3–5 KPIs: OEE, On-Time Delivery, First Pass Yield, Schedule Adherence, and Cycle Time. Tracking more metrics simultaneously degrades data quality and reduces team engagement with the improvement process.
What is finite capacity scheduling?
Finite capacity scheduling is a production planning method that only releases jobs to the floor when the required machines and labor are available. It prevents WIP congestion and keeps queue times from inflating across the production system.