

TL;DR:
- Statistical Process Control in machining uses real-time control charts to monitor process stability and prevent defects. It distinguishes between process variation and customer requirements, enabling early detection of special causes. Proper implementation involves automated probing, correct data grouping, and understanding capability indices like Cpk for quality decisions.
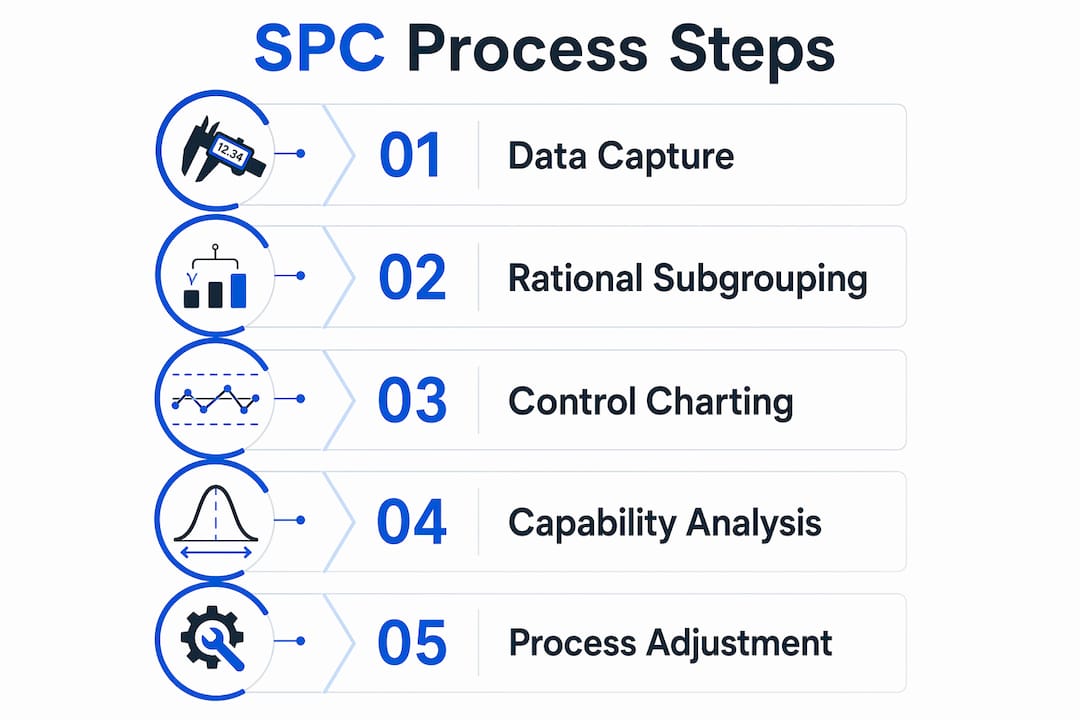
Statistical Process Control (SPC) in machining is defined as the application of statistical methods to monitor and control manufacturing processes so they remain stable, producing parts that consistently meet specifications with minimal waste. SPC is not a final inspection tool. It is a real-time process management system that distinguishes between normal process variation and signals that require action. For engineers running CNC milling, turning, or Hydromat operations, understanding what is SPC in machining means understanding the difference between a process that is simply running and one that is genuinely under control. The core tools are control charts, capability indices like Cpk, and in-process probing feedback loops that catch drift before a single defective part leaves the machine.
What is SPC in machining and how does it work?

Statistical process control applies statistical methods to monitor and control process stability, separating common-cause variation from special-cause variation using control charts. Common-cause variation is the natural, predictable noise in any machining process: minor spindle runout, slight material hardness variation, ambient temperature fluctuations. Special-cause variation is an assignable event: a worn insert, a loose fixture, a thermal spike. SPC’s job is to detect special causes early, before they produce out-of-tolerance parts.
Control charts are the primary instrument. They plot time-ordered measurements against statistically calculated control limits. A point outside those limits signals a special cause requiring investigation. The critical distinction every machining engineer must internalize is this: control limits differ from specification limits. Control limits describe the natural variability of a stable process. Specification limits describe what the customer requires. A process can be in statistical control and still produce parts that fail inspection. These are two separate questions answered by two separate tools.
X̄-R charts and process capability indices
X̄-R charts are standard in CNC machining. The X-bar chart tracks subgroup averages, revealing mean shifts caused by tool wear or thermal drift. The R chart tracks subgroup range, revealing changes in process consistency caused by vibration, fixture instability, or coolant variation. Together, they give a complete picture of both where the process is centered and how much it is spreading.
Process capability indices, Cp and Cpk, answer the specification question. Cp measures how wide the process spread is relative to the tolerance band. Cpk adjusts for centering. A process with a high Cp but a low Cpk is capable but off-center. The table below summarizes the most common SPC control charts and their typical machining applications.
| Chart type | What it monitors | Typical machining use |
|---|---|---|
| X̄-R chart | Subgroup mean and range | Diameter, length, bore depth on CNC turning |
| X̄-S chart | Subgroup mean and standard deviation | High-volume milling with large subgroup sizes |
| Individuals (I-MR) chart | Individual measurements and moving range | Low-volume, one-part-per-cycle operations |
| P chart | Proportion of nonconforming units | Attribute data: pass/fail gauging |
| CUSUM chart | Cumulative sum of deviations | Detecting small, gradual mean shifts from tool wear |
Pro Tip: Never use your control limits to judge whether parts meet customer specifications. Post both limits on your chart display so operators can see them side by side, but train them to respond to control limit violations, not specification limit violations. Reacting to spec limits on a control chart is a fast path to over-adjustment.
How is SPC implemented in CNC machining environments?
In-process probing on CNC machines creates a feedback loop where measurements trigger automatic tool offset adjustments, preventing defects before they occur. This is the practical engine of SPC in a modern machining cell. The sequence runs continuously during production without stopping the cycle.
A typical SPC feedback loop in CNC machining follows these steps:
- Probe the critical dimension on the finished or semi-finished part using an on-machine touch probe or post-process gauging station.
- Log the measurement into the active X̄-R chart, updating the subgroup data in real time.
- Evaluate control rules automatically. Common rules include: one point beyond three sigma, five consecutive points trending in one direction, or eight points on one side of the centerline.
- Trigger a tool offset adjustment when a trend rule fires, compensating for wear or thermal growth before the dimension drifts out of tolerance.
- Verify the correction on the next part cycle, confirming the offset brought the process back to center.
- Escalate to operator or stop the machine if a point falls outside control limits after correction, indicating a special cause beyond normal wear.
Automated inspection requires data capture via interfaces like MTConnect or Ethernet/IP to move measurement data from the machine controller into SPC software without manual entry. Manual data entry introduces transcription errors and delays that undermine the real-time value of SPC. Modern SPC platforms connect directly to Renishaw probing systems, Marposs gauging stations, or Blum tool setters to pull data automatically.
Rational subgrouping is critical for trustworthy control charts. Subgroup measurements must come from homogeneous conditions: the same setup, the same tool, the same spindle. Mixing measurements from two different fixtures or two different tool inserts into one subgroup hides special causes and generates false signals. This is one of the most common SPC implementation errors in high-volume machining shops.
Pro Tip: Validate measurement metadata before any SPC chart goes live. Confirm that each data record carries the correct feature name, nominal value, tool ID, and offset number. A routing error that sends bore measurements to a diameter chart will generate meaningless signals and erode operator trust in the entire system.
What are the key benefits and challenges of SPC in machining?
SPC moves quality assurance from reactive inspection to proactive process management. Instead of sorting defective parts after the fact, SPC controls the process so defective parts are far less likely to be produced. For high-volume operations producing millions of parts annually, that shift in philosophy has direct financial consequences.
The benefits for machining operations are concrete:
- Defect reduction: Early detection of special-cause variation stops defect-producing conditions before they generate scrap.
- Scrap and rework minimization: Fewer out-of-tolerance parts mean lower material loss and less labor spent on rework cycles.
- Extended tool life: Tool life can be extended 30–50% by compensating for wear through offset adjustments rather than replacing inserts on a fixed schedule.
- Improved throughput: Fewer unplanned stoppages for scrap investigation keep machines cutting.
- Process knowledge: Control charts accumulate a historical record of process behavior that supports engineering decisions on feeds, speeds, and tooling.
The challenges are equally real:
- Calibration discipline: Probes and gauges must be calibrated on a defined schedule. An uncalibrated measurement system produces control charts that reflect gauge error, not process behavior.
- Rule tuning: Applying too many Western Electric rules simultaneously increases false alarm rates. Each false alarm costs operator time and erodes confidence in the system.
- Over-adjustment risk: Operators who adjust the process in response to common-cause variation make the process worse, not better. This is called tampering, and SPC training must address it directly.
- Data integrity: A process in control is not necessarily within specification. This nuance requires ongoing training so engineers do not mistake a stable chart for a capable process.
How to interpret SPC results and use capability metrics
Reading a control chart correctly requires distinguishing between two types of signals. A single point beyond the three-sigma control limit is a strong signal of special-cause variation requiring immediate investigation. Non-random patterns within the control limits, such as a run of seven consecutive points above the centerline or a consistent upward trend, also indicate special causes. Combining stability monitoring with capability indices gives the complete picture of process performance.
Cpk is the index that matters most for machining quality decisions. It accounts for both spread and centering. A Cpk of 1.00 means the process is just fitting within tolerance, with roughly 2,700 defects per million opportunities at the three-sigma level. A Cpk of 1.33 reduces that to approximately 64 defects per million. Aerospace and defense customers typically require Cpk of 1.67 or higher for critical dimensions.
| Cpk value | Process condition | Approximate defect rate |
|---|---|---|
| Below 1.00 | Not capable | More than 2,700 per million |
| 1.00–1.33 | Marginally capable | 64–2,700 per million |
| 1.33–1.67 | Capable | 6–64 per million |
| 1.67 and above | Highly capable | Fewer than 6 per million |
| 2.00 and above | Six Sigma level | Near zero defects |
A process with a good Cp but a poor Cpk is capable but off-center. The fix is process centering, not spread reduction. Adjusting the tool offset or fixture position to move the mean toward nominal will improve Cpk without any change to the underlying process variability. This is a common and correctable condition in CNC turning operations where thermal growth shifts the mean over a production run.
Pro Tip: Do not react to every point that moves within control limits. Common-cause variation is expected and normal. Reserve your investigation resources for genuine control chart signals. Chasing noise is the single most expensive mistake in SPC implementation.
For engineers who need to align SPC data with customer tolerance requirements, understanding machining tolerance specifications is a necessary foundation before interpreting capability indices.
Key Takeaways
SPC in machining is the discipline of using control charts and capability indices together to keep processes stable and centered within customer specifications, not just running.
| Point | Details |
|---|---|
| SPC definition | Statistical Process Control monitors machining stability using control charts to separate normal from special-cause variation. |
| Control vs. specification limits | Control limits describe process variability; specification limits describe customer requirements. Never confuse the two. |
| CNC feedback loop | In-process probing triggers automatic tool offset adjustments, preventing defects before they occur in production. |
| Cpk drives decisions | A Cpk above 1.33 is the minimum for most industrial customers; aerospace and defense typically require 1.67 or higher. |
| Rational subgrouping | Group measurements from homogeneous conditions only. Mixing setups or tooling states corrupts control chart signals. |
Why SPC is non-negotiable in competitive machining
I have seen shops run control charts on a wall poster that nobody updates after the first week. That is not SPC. That is paperwork. Real SPC is a live data pipeline connected to the machine, with rules that fire automatically and operators who know exactly what to do when a signal appears.
The shops that treat SPC as a compliance checkbox consistently underperform on scrap rates and customer returns. The shops that treat it as an engineering tool, feeding chart data back into process development decisions, are the ones that can hold tight tolerances at volume without heroic effort on the floor.
The future of SPC in machining is full integration with MES platforms and Industry 4.0 automation frameworks. Real-time SPC evaluation, automatic offset correction, and instant escalation alerts are already standard in leading high-volume facilities. The statistical principles have not changed since Walter Shewhart developed control charts at Bell Labs in the 1920s. What has changed is the speed and scale at which those principles can be applied.
My strongest recommendation: treat your measurement data pipeline as a first-class engineering system. Calibrate it. Validate it. Audit it. A control chart is only as reliable as the measurement system feeding it. Get that right first, and the rest of SPC implementation follows logically.
— Andrew
How Machiningtechllc supports precision machining quality
Machiningtechllc has operated from its 70,000 square foot facility in Webster, Massachusetts since 1985, producing over 20 million parts annually for aerospace, defense, and industrial customers. Quality at that volume requires more than good tooling. It requires a process control discipline built into every production cell.
Machiningtechllc’s precision parts manufacturing capabilities include CNC milling, turning, Hydromat systems, and wire EDM, all supported by quality assurance processes aligned with the SPC principles covered in this article. If your operation needs a contract machining partner with the process control infrastructure to hold tight tolerances at high volume, Machiningtechllc is the right conversation to start. Explore the full list of precision machining services to find the right fit for your production requirements.
FAQ
What is SPC in machining, in simple terms?
SPC in machining is the use of statistical control charts and capability indices to monitor production processes in real time, detecting problems before they produce defective parts. It replaces end-of-line inspection with continuous in-process monitoring.
What is the difference between control limits and specification limits?
Control limits are calculated from actual process data and describe normal process variation. Specification limits are set by the customer or engineering drawing. A process can be within control limits but still produce out-of-specification parts.
What does Cpk measure in a machining process?
Cpk measures how well a stable machining process fits within the customer’s tolerance band, accounting for both spread and centering. A Cpk of 1.33 or higher is the standard minimum for most industrial machining applications.
How does in-process probing support SPC on CNC machines?
On-machine probing measures critical dimensions during or immediately after each cycle, feeding data directly into control charts. When a trend rule fires, the system triggers an automatic tool offset adjustment to correct drift before parts go out of tolerance.
What is rational subgrouping and why does it matter?
Rational subgrouping means collecting each SPC subgroup from homogeneous production conditions, such as a single tool and setup. Mixing data from different tools or fixtures into one subgroup hides real process signals and generates false alarms, making the control chart unreliable.
Recommended
- Optimize high-volume machining workflow: aerospace precision | Machining Technologies
- Aerospace machining: precision processes and standards | Machining Technologies
- Machinability of materials guide for precision 2026 | Machining Technologies
- What Is Multi-Spindle Machining: Engineer’s 2026 Guide | Machining Technologies